Important Questions
Multiple Choice Questions:
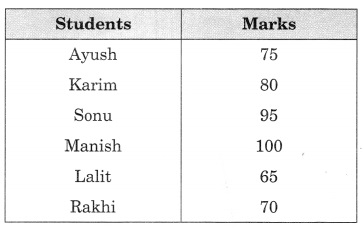
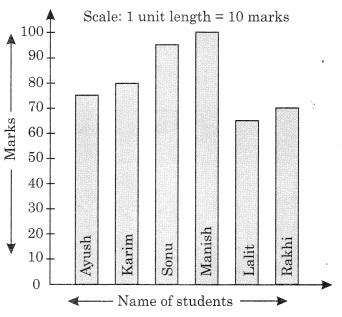
Q.1 The maximum marks obtained by any student is
(a) 95
(b) 78
(c) 75
(d) 25.
Q.2 The minimum marks obtained by any student is
(a) 95
(b) 78
(c) 75
(d) 25
Q.3 How many students got the same marks?
(a ) 2
(b) 3
(c) 4
(d) 5
Q.4 The difference between the maximum and mini-mum marks obtained is
(a) 60
(b) 50
(c) 70
(d) 80.
Q.5 How many students got 75 or more marks?
(a) 1
(b) 2
(c) 3
(d) 4
Q.6 How many students got marks below 60?
(a) 1
(b) 2
(c) 3
(d) 4
Q.7 How many students got marks between 60 and 75?
(a) 1
(b) 2
(c) 3
(d) 4.
Q.8 Following frequency distribution table shows marks (out of 50) obtained in English
by 45 students of class VI. Which two classes have the same frequency?
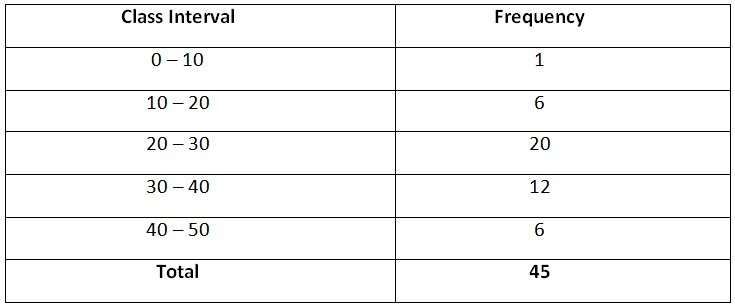
(a) 10 - 20 and 40 - 50
(b) 10 - 20 and 20 - 30
(c) 20 - 30 and 40 – 50
(d) None of these
Q.9 The pictograph shows the numbers of goals scored by four soccer teams in a season.
How many goals did Kickers score?
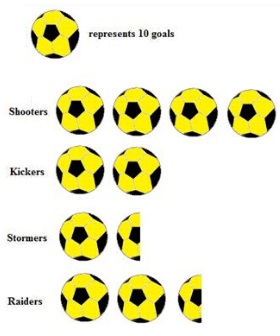
(a) 20
(b) 10
(c) 15
(d) None of these
Q.10 A _______ is a collection of numbers gathered to give some information.
(a) Tally mark
(b) Data
(c) None of these
(d) Frequency
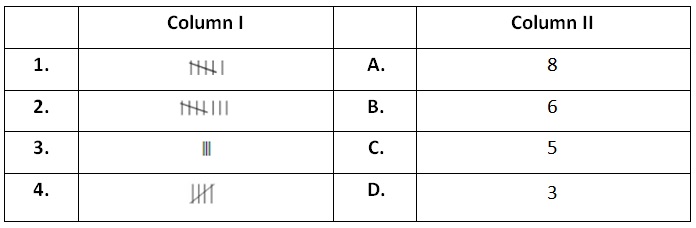
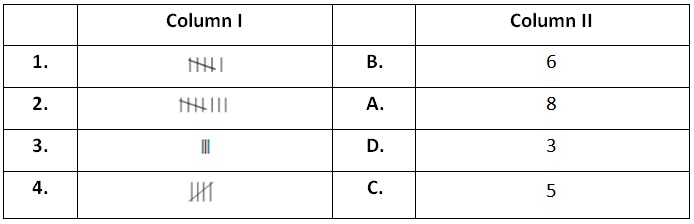
Match The Following:
Fill in the blanks:
1. Representation of data with the help of tally marks is called _________.
2. In a bar graph width of rectangle is always _________.
3. The tally mark represents ________.
4. In a bar graph, _______ can be drawn horizontally and vertically.
True /False:
1. A bar graph represents data in the form of pictures, object or parts of objects.
2. Data is a collection of numerical figures giving required information.
3. In a bar graph width of rectangle is always equal.
4. The tally mark ![]() represents 5.
represents 5.
Very Short Questions:
1. A collection of numbers gathered to give some information is called?
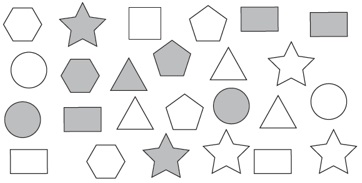
2. For a math assignment a group of students had to draw their favorite shapes.
The following pictures represent their choices. Each picture stands for 25 shapes.
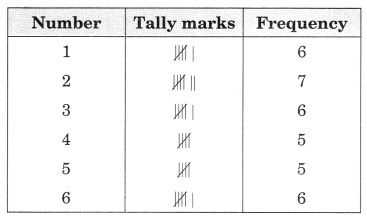
3. A die was thrown 35 times and the following numbers were obtained:
5, 1, 4, 2, 3, 2, 6, 6, 1, 4, 2, 5, 4, 5, 3, 6, 1, 5
2, 6, 2, 5, 4, 1, 3, 2, 1, 4, 1, 6, 2, 6, 3, 3, 3
Prepare a frequency table for the data.
4. The result of a Mathematics test is as follows:
80, 90, 70, 80, 80, 60, 80, 70, 90, 65, 100, 60, 70, 60, 70, 85, 65, 70, 70, 85, 90, 60, 65, 80, 60
Make a frequency table for the above data and answer the following questions:
(a) What is the maximum marks obtained?
(b) How many students score less than 75 marks?
(c) How many students scored 80 marks or above?
(d) How many students appeared in the test?
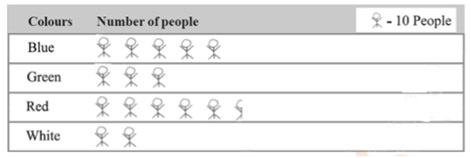
5. The colors of fridges preferred by people living in a locality are shown by the following
pictograph Which colour most liked by the people?
6. In a village six fruit merchants sold the following number of fruit baskets in a particular season:
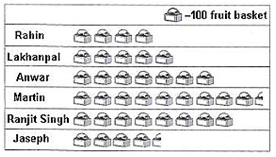
Observe this pictograph and answer the following questions:
(a) Which merchant sold the maximum number of baskets?
(b) How many fruit baskets were sold by Answer?
(c) The merchants who have sold 600 or more number of baskets are planning to buy a godown
for the next season. Can you name them?
7. The bar graph shows the number of toys produced by a factory during a certain week:
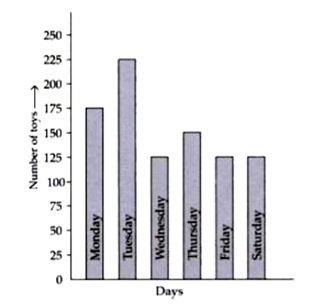
Answer the following questions:
(a) On which day the maximum number of toys were produced?
(b) On which day equal number of toys were produced?
(c) What is the total number of toys produced during the week?
(d) In which day minimum number of toys were produced?
Short Questions:
1. Mr. Rajan made a pictograph given below to show the number of cars washed at a car
washing station during three days of a week.
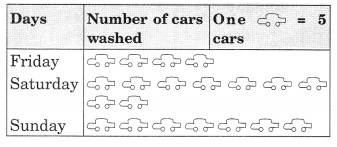
From the pictograph, find that:
(a) How many cars were washed on
(i) Friday
(ii) Saturday
(iii) Sunday?
(b) On which day the maximum number of cars were washed at the station?
(c) On which day the minimum number of cars were washed at the station?
(d) How many more cars were washed on Saturday than on Friday?
2. Read the pictograph given below and answer the following questions:
Persons employed in one year
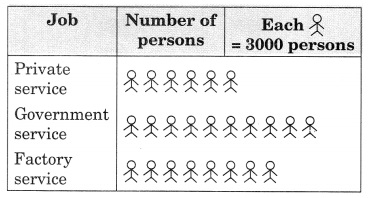
(a) What is the number of persons employed in government service?
(b) How many more person were employed in government service than in private service?
(c) In which service, were the maximum number of persons employed?
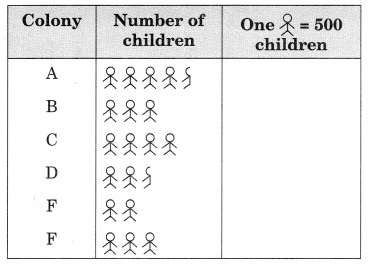
3. In March 2012, children for six colonies of Meerut were given pulse polio Drops.
The colony wise number of children were as follows:
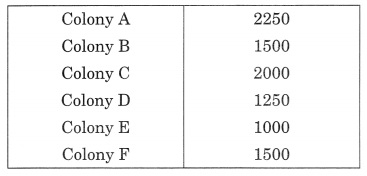
Represent the data by pictograph.
4. The given bar graph represents the frequency of a, e, i, o, and u in a piece of English writing.
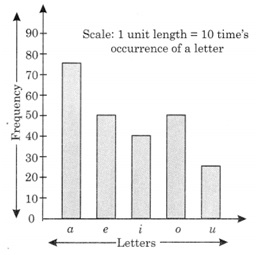
(a) Which letter occurred the maximum number of times?
(b) Which letter occurred 40 times?
(c) Which letter occurred less than 30 times?
(d) Write down the five letters in the decreasing order of frequencies.
Long Questions:
1. The marks obtained by six students in Mathematics are given below. Represent the. data by a bar graph.
Use a scale of 0.5 cm for each name on the horizontal axis and 0.5 cm for 10 marks on the vertical axis.
2. A survey of 120 school students was done to find which activity they prefer to do in their free time:
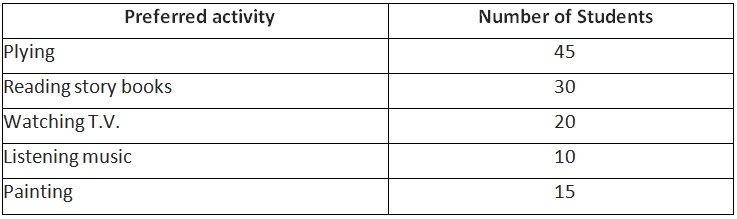
Draw a bar graph to illustrate the above data taking scale of 1 unit length = 5 students.
Which activity is preferred by most of the students other than playing?
Assertion and Reason Questions:
(1.) Assertion (A) – The maximum marks obtained by any student is 95 out of 100
Reason (R) – Data is a collection of numbers gathered to give some information.
(a) Both A and R are true and R is the correct explanation of A
(b) Both A and R are true but R is not the correct explanation of A
(c) A is true but R is false
(d) A is false but R is true
(2.) Assertion (A) – The minimum marks obtained by any student is 100 out of 100
Reason (R) – Data is a collection of numbers gathered to give some information.
(a) Both A and R are true and R is the correct explanation of A
(b) Both A and R are true but R is not the correct explanation of A
(c) A is true but R is false
(d) A is false but R is true
ANSWER KEY -
Multiple Choice questions:
1. (a) 95
2. (d) 25
3. (a) 2
Hint:
62, 62
4. (c) 70
Hint:
95 – 25 = 70
5. (c) 3
Hint:
95, 78, 75
6. (d) 4.
Hint:
55, 36, 42, 25
7. (c) 3
Hint:
62,62,73
8. (a) 10 – 20 and 40 – 50
9. (a) 20
10. (b) Data
Match The Following:
Fill in the blanks:
1. Representation of data with the help of tally marks is called frequency distribution table.
2. In a bar graph width of rectangle is always equal.
3. The tally mark
![]() represents 5.
represents 5.
4. In a bar graph, bar can be drawn horizontally and vertically.
True /False:
1. False. A pictograph represents data in the form of pictures, object or parts of objects.
2. True
3. True
4. True
Very Short Answer:
1. Data is collection of numbers gathered to give some information.
2. Total pictures = 25
Each picture stands for 25 shapes.
So, Total shapes students drew altogether = 25 × 25 = 625 shapes
3. From the given data, we have the following table.
4. From the above information, we have the following table.
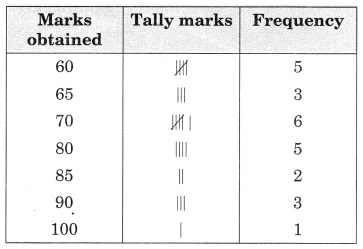
(a) Maximum marks obtained by a student = 100
(b) 5 + 3 + 6 = 14 students obtained marks less than 75.
(c) 5 + 2 + 3 + 1 = 11 students scored marks 80 or above 80.
(d) Total 25 students were appeared in the test.
5. Number of people liked Red colour = 5 × 10 + 5 = 55
Number of people liked White colour = 2 × 10 = 20
Number of people liked Green colour = 3 × 10 = 30
Number of people liked Blue colour = 5 × 10 = 20
Hence, Red colour most liked by the people.
6. (a) martin sold the maximum number of baskets.
(b) 7 × 100 = 700 fruit baskets were sold by Answer.
(c) Answer, Martin and Ranjit Singh are planning to buy a godown for the next season.
7. (a) The maximum number of toys were produced on Tuesday.
(b) Wednesday and Thursday, Friday and Saturday have equal number of toys were produced.
(c) Total number of toys produced in the week = 175 + 225 + 150 + 150 + 125 + 125 = 900
(d) Minimum number of toys were produced on Friday and Saturday.
Short Answer:
1. (a) (i) On Friday – 4 × 5 = 20 cars
(ii) On Saturday – 9 × 5 = 45 cars
(iii) On Sunday – 7 × 5 = 35 cars.
(b) On Saturday, the maximum number of cars,
i.e., 9 × 5 = 45 were washed at the stations.
(c) On Friday, the minimum number of cars,
i.e., 4 × 5 = 20 were washed on the station.
(d) 45 – 20 = 25 more cars were washed on Saturday than on Friday.
2. (a) Number of persons employed in government service = 10 x 3000 = 30,000
(b) 10 x 3000 – 6 x 3,000 = 30,000 – 18,000 = 12,000 persons were employed more
in government service than in private service.
(c) In government service, the maximum number of persons were employed.
3. Pictograph:
4. (a) a letter occurred the maximum number of times.
(b) i letter occurred 40 times.
(c) u letter occurred less than 30 times.
(d) a, e, o, i, u is the decreasing order of their frequencies.
Long Answer:
1. The required bar graph is given as below:
2. (1) Draw two perpendicular lines – one vertical and one horizontal.
(2) Along horizontal line mark the “Preferred activity” and along vertical line mark the “No. of students”.
(3) Take bars of same width keeping uniform gap between them.
(4) Take scale of 1 unit length = 5 students along the vertical line and then mark the corresponding values.
(5) Calculate the heights of the bars for various activities preferred as shown below:
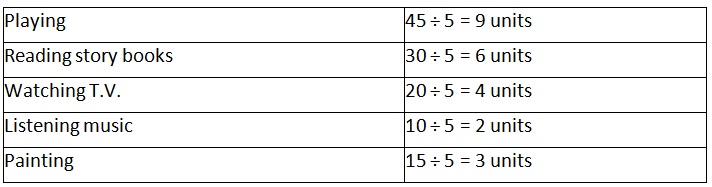
(6) Now draw various bars.
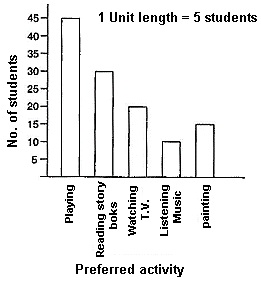
The activity “Reading story books” is preferred by most of the students other than playing.
Assertion and Reason Answers:
(1) (a) A is false but R is true
(2) (b) A is false but R is true