
1. C 2 . C 3. A 4 . C 5. D 6 C 7. D
8. A 9. A 10. A 11. C 12. D
SUBJECTIVE :
1. (i) maximum number of families with different number of members in family
(ii) 50
(iii) 3, 120
(iv) 8, 9, 10; 10
5. Monday (10), Tuesday (15), Wednesday (10), Thursday (20), Friday(15)
6. (a) 48 (b) Water park (c) Sea side (d) 16
8 (a) 18000 (b) 14000 (c) 2007
In questions 1 to 5, out of the four options, only one is correct. write the correct answer.
1. Using tally marks, which one of the following represents the number eight:
![]()
2. The marks (out of 10) obtained by 28 students in a Mathematics test are listed as below:
8, 1, 2, 6, 5, 5, 5, 0, 1, 9, 7, 8, 0, 5, 8, 3, 0, 8, 10, 10, 3, 4, 8, 7, 8, 9,2, 0
The number of students who obtained marks more than or equal to 5 is
(A) 13 (B) 15 (C) 16 (D) 17
3. In question 2 above, the number of students who scored marks less than 4 is
(A) 15 (B) 13 (C) 12 (D) 10
4. The choices of the fruits of 42 students in a class are as follows:
A , O , B , M , A , G , B , G , A , G , B , M , A , G , M , A , B , G , M , B , A , O , M , O , G , B , O , M G , A , A , B , M , O , M , G , B , A , M , O , M , O,
where A, B, G, M and O stand for the fruits Apple, Banana, Grapes, Mango and Orange respectively.
Which two fruits are liked by an equal number of students?
(A) A and M (B) M and B (C) B and O (D) B and G
5. According to data of question 4, which fruit is liked by most of the students?
(A) O (B) G (C) M (D) A
In questions 6 to 13, state whether the given statements are true (T) or false (F).
6. In a bar graph, the width of bars may be unequal.
7. In a bar graph, bars of uniform width are drawn vertically only.
8. In a bar graph, the gap between two consecutive bars may not be the same.
9. In a bar graph, each bar (rectangle) represents only one value of the numerical data.
10. To represent the population of different towns using bar graph, it is convenient to take one unit length to represent one person.
11. Pictographs and bar graphs are pictorial representations of the numerical data.
12. An observation occurring five times in a data is recorded as | | | | |, using tally marks.
13. In a pictograph, if a symbol  represents 50 books in a library shelf, then the symbol represents 25 books.
14. A _______ is a collection of numbers gathered to give some meaningful information.
15. The data can be arranged in a tabular form using _______ marks.
16. A _______ represents data through pictures of objects.
17. In a bar graph, ________ can be drawn horizontally or vertically.
18. In a bar graph, bars of ________ width can be drawn horizontally or vertically with ________ spacing between them.
19. An observation occurring seven times in a data is represented as ________ using tally marks.
20. In a pictograph, if a symbol ![]() represents 20 flowers in a basket then
represents 20 flowers in a basket then![]()
![]()
![]() stands for ________ flowers.
stands for ________ flowers.
21. On the scale of 1 unit length = 10 crore, the bar of length 6 units will represent ________ crore and of ——— units will represent 75 crore.
22. In an examination, the grades achieved by 30 students of a class are given below. Arrange these grades in a table using tally marks:
B, C, C, E, A, C, B, B, D, D, D, D, B, C, C, C, A, C, B, E, A, D, C, B, E, C, B, E, C, D
23. The number of two wheelers owned individually by each of 50 families are listed below. Make a table using tally marks.
1, 1, 2, 1, 1, 1, 2, 1, 2, 1, 0, 1, 1, 2, 3, 1, 2, 1, 1, 2, 1, 2, 3, 1, 0, 2, 1, 0, 2, 1, 2, 1, 2, 1, 1, 4, 1, 3, 1, 1, 2, 1, 1, 1, 1,2, 3, 2, 1, 1
Find the number of families having two or more, two wheelers.
24. The lengths in centimetres (to the nearest centimetre) of 30 carrots are given as follows:
15, 22, 21, 20, 22,15, 15, 20, 20,15, 20, 18,20, 22, 21,
20, 21, 18, 21, 18, 20, 18, 21, 18, 22, 20, 15, 21, 18, 20
Arrange the data given above in a table using tally marks and answer the following questions.
(a) What is the number of carrots which have length more than 20 cm?
(b) Which length of the carrots occur maximum number of times? Minimum number of times?
25. Thirty students were interviewed to find out what they want to be in future. Their responses are llisted as below:
doctor, engineer, doctor, pilot, officer, doctor, engineer, doctor, pilot, officer, pilot, engineer, officer, pilot, doctor, engineer, pilot, officer, doctor, officer, doctor, pilot, engineer, doctor, pilot, officer, doctor,
pilot, doctor, engineer
Arrange the data in a table using tally marks.
26. Following are the choices of games of 40 students of Class VI:
football, cricket, football, kho-kho, hockey, cricket, hockey, kho-kho, tennis, tennis, cricket, football, football, hockey, kho-kho, football, cricket, tennis, football, hockey, kho-kho, football, cricket, cricket,
football, hockey, kho-kho, tennis, football, hockey, cricket, football, hockey, cricket, football, kho- kho, football, cricket, hockey, football.
(a) Arrange the choices of games in a table using tally marks.
(b) Which game is liked by most of the students?
(c) Which game is liked by minimum number of students?
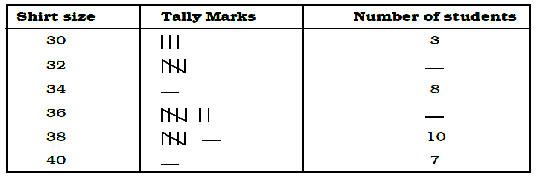
27. Fill in the blanks in the following table which represents shirt size of 40 students of a school.
28. Following pictograph represents some surnames of people listed in the telephone directory of a city
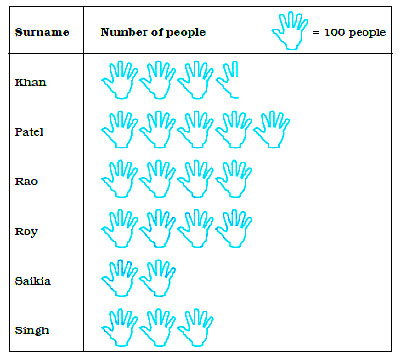
Observe the pictograph and answer the following questions:
(a) How many people have surname ‘Roy’?
(b) Which surname appears the maximum number of times in the telephone directory?
(c) Which surname appears the least number of times in the directory?
(d) Which two surnames appear an equal number of times?
29. Students of Class VI in a school were given a task to count the number of articles made of different materials in the school.
The information collected by them is represented as follows:
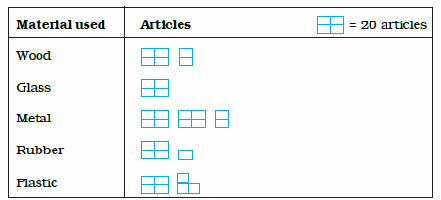
Observe the pictograph and answer the following questions:
(a) Which material is used in maximum number of articles?
(b) Which material is used in minimum number of articles?
(c) Which material is used in exactly half the number of articles as those made up of metal?
(d) What is the total number of articles counted by the students?
30. The number of scouts in a school is depicted by the following pictograph:
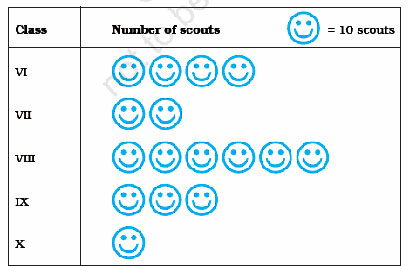
Observe the pictograph and answer the following questions:
(a) Which class has the minimum number of scouts?
(b) Which class has the maximum number of scouts?
(c) How many scouts are there in Class VI?
(d) Which class has exactly four times the scouts as that of Class X?
(e) What is the total number of scouts in the Classes VI to X?
31. A survey was carried out in a certain school to find out the popular school subjects among students of Classes VI to VIII. The data in this regard is displayed as pictograph given below:
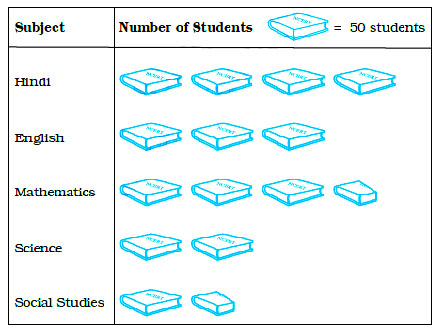
(a) Which subject is most popular among the students?
(b) How many students like Mathematics?
(c) Find the number of students who like subjects other than Mathematics and Science.
32. The following pictograph depicts the information about the areas in sqkm (to nearest hundred) of some districts of Chhattisgarh State:
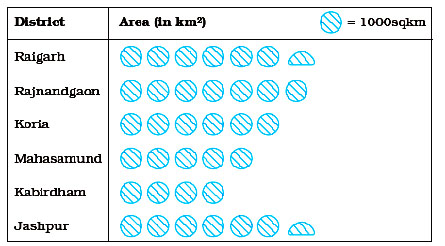
(a) What is the area of Koria district?
(b) Which two districts have the same area?
(c) How many districts have area more than 5000 square kilometres?
33. The number of bottles of cold drinks sold by a shopkeeper on six consecutive days is as follows:
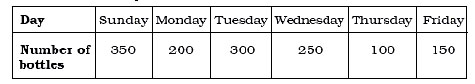
Prepare a pictograph of the data using one symbol to represent 50 bottles.
34. The following table gives information about the circulation of newspapers (dailies) in a town in five languages.
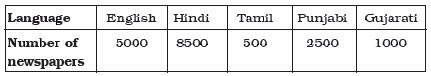
Prepare a pictograph of the above data, using a symbol of your choice, each representing 1000 newspapers.
35. Annual expenditure of a company in the year 2007-2008 is given below:
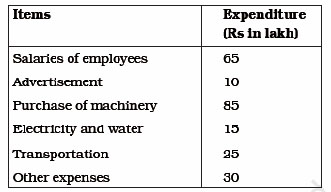
Prepare a pictograph of the above data using an appropriate symbol to represent Rs 10 lakh.
36. The following bar graph shows the number of houses (out of 100) in a town using different types of fuels for cooking.
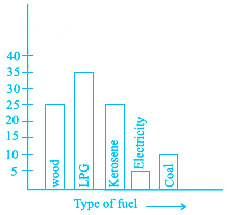
(a) Which fuel is used in maximum number of houses?
(b) How many houses are using coal as fuel?
(c) Suppose that the total number of houses in the town is 1 lakh. From the above graph estimate the number of houses using electricity.
37. The following bar graph represents the data for different sizes of shoes worn by the students in a school. Read the graph and answer the following questions.
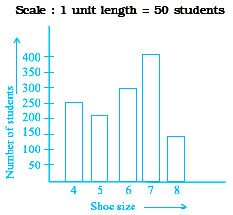
(a) Find the number of students whose shoe sizes have been collected.
(b) What is the number of students wearing shoe size 6?
(c) What are the different sizes of the shoes worn by the students?
(d) Which shoe size is worn by the maximum number of students?
(e) Which shoe size is worn by minimum number of students?
(f) State whether true or false:
The total number of students wearing shoe sizes 5 and 8 is the same as the number of students wearing shoe size 6.
1. D 2. D 3. D 4. D 5. C