
STATISTICS
A. Measures of Central Tendency
It is that single value which may be taken as the most suitable representative of the data. This single value is known as the average. Averages are generally, the central part of the distribution and therefore, they are also called the measures of Central Tendency. It can be divided into two groups:
(a) Mathematical average :
(i) Arithmetic mean or mean
(ii) Geometric mean
(iii) Harmonic mean
(b) Positional average :
(i) Median (ii) Mode or positional average
B. arithmetic mean
(1) Individual observation or unclassified data :
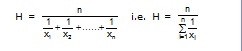
If x1, x2,.....xn be n observations, then their arithmetic mean is given by
![]()
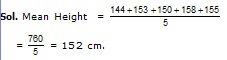
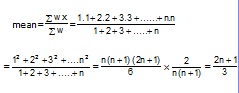
Ex.1 If the heights of 5 persons are 144 cm, 153cm, 150 cm, 158 cm and 155 cm respectively, then mean height is-
(A) 150 cm (B) 151 cm (C) 152 cm (D) None of these
(2) Arithmetic mean of discrete frequency distribution :
Let x1, x2,.......,xn be n observation and let f1, f2, ....., fn be their corresponding frequencies, then their mean
![]()
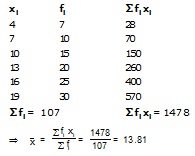
Ex.2 Arithmetic mean of the following frequency distribution :
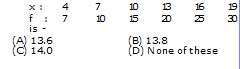
Sol. The given frequency distribution is-
(a) Short cut method : If the values of x or (and) f are large the calculation of arithmetic mean by the previous formula used, is quite tedious and time consuming. In such case we take the deviation from an arbitrary point A.
![]()
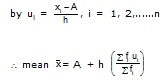
(b) Step deviation method : Sometimes during the application of shortcut method of finding the mean, the deviation di are divisible by a common number h (say). In such case the arithmetic is reduced to a great extent taken
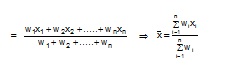
(3) Weighted arithmetic mean : If
w1, w2,w3,.....,wn are the weight assigned to the values x1, x2, x3,.....,xn respectively, then the weighted average is defined as -
Weighted A.M.
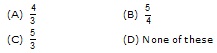
Ex.3 The weighted mean of first n natural number if their weight are the same as the number is-
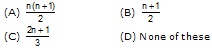
Sol. Here the numbers are 1, 2, 3,....., n and their weights also are respectively 1, 2, 3.....n so weighted
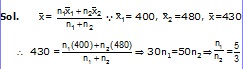
(4) Combined mean : If , ,......, are the mean of k series of sizes n1, n2,....,nk respectively then the mean of the composite ![]()
Ex.4 The mean income of a group of persons is Rs.400. Another group of persons has mean income Rs.480. If the mean income of all the persons in the two groups together is Rs.430, then ratio of the number of persons in the groups:
(5) Properties of Arithmetic Mean :
(i) In a statistical data, the sum of the deviation of items from A.M. is always zero.
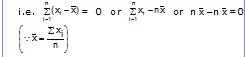
(ii) In a statistical data, the sum of squares of the deviation of items from A.M. is least
![]()
(iii) If each of the n given observation be doubled, then their mean is doubled.
(iv) If is the mean of x1, x2,......,xn . The mean of ax1, ax2,.....,axn is a where a is any number different from zero.
(v) Arithmetic mean is independent of origin i.e. it is not effected by any change in origin.
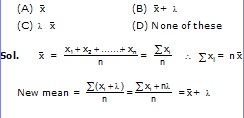
Ex.5 The mean of a set of number is if each number is increased by l, then mean of the new set is-
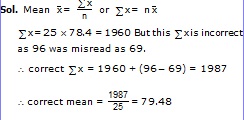
Ex.6 Mean of 25 observations was found to be 78.4. But later on it was found that 96 was misread 69. The correct mean is
(A) 79.24 (B) 79.48 (C) 80.10 (D) None of these
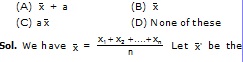
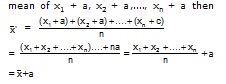
Ex.7 If is the mean of x1, x2,....,xn then mean of x1 + a, x2 + a, .....,xn+ a where a is any number positive or negative is-
(6) MERITS AND DEMERITS OF ARITHMETIC MEAN :
(a) Merits of Arithmetic Mean :
(i) It is rigidly defined.
(ii) It is based on all the observation taken.
(iii) It is calculated with reasonable ease and rapidity.
(iv) It is least affected by fluctuations in sampling.
(v) It is based on each observation and so it is a better representative of the data.
(vi) It is relatively reliable.
(vii) Mathematical analysis of mean is possible.
(b) Demerits of Arithmetic Mean :
(i) It is severely affected by the extreme values.
(ii) It cannot be represented in the actual data since the mean does not coincide with any of the observed value.
(iii) It cannot be computed unless all the items are known.
(iv) It cannot be calculated for qualitative data incapable of numerical measurements.
(v) It cannot be used in the study of ratios, rates etc.
C. GEOMETRIC MEAN
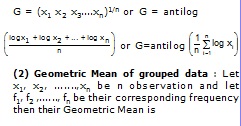
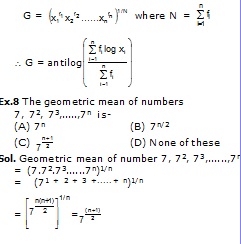
(1) Individual data : If x1, x2, x3,......, xn are n values of a variate x, none of them being zero, then the geometric mean G is defined as-
D. harmonic mean
Harmonic mean is reciprocal of mean of reciprocal.
(1) Individual observation : The H.M. of
(2) H.M. of grouped data : Let x1, x2,...., xn be n observation and let f1, f2,.........,fn be their corresponding frequency then H.M. is

Ex.9 Harmonic mean of 2, 4, 5 is.....
(A) 4.21 (B) 3.16 (C) 2.98 (D) None of these
Sol. The harmonic mean of 2, 4 and 5 is
![]()
Note: Relation between A.M. , G.M., and H.M. A.M. ³ G.M.³ H.M., Equality sign holds only when all the observations in the series are same.
E. MEDIAN
Median is the middle most or the central value of the variate in a set of observations, when the observations are arranged either in ascending or in descending order of their magnitudes. It divides the arranged series in two equal parts.
(1) Median of an individual series : Let n be the number of observations-
(i) arrange the data in ascending or descending order.
(ii) (a) if n is odd then Median (M)
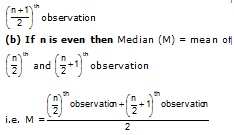
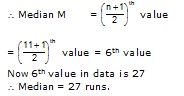
Ex.10 The number of runs scored by 11 players of a cricket team of school are 5, 19, 42, 11, 50, 30, 21, 0, 52, 36, 27. The median is-
(A) 21 (B) 27 (C) 30 (D) None of these
Sol. Let us arrange the value in ascending order 0, 5, 11, 19, 21, 27, 30, 36, 42, 50, 52
 (2) Median of the discrete frequency distribution: Algorithm to find the median :
Step - I : Find the cumulative frequency (C. F.)
![]()
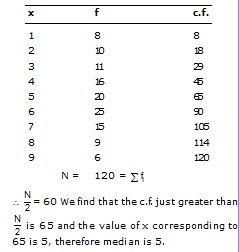
Step -III : See the cumulative frequency (C.F.) just greater than and determine the corresponding value of the variable.
Step-IV : The value obtained in step III is the median.
Ex.11 The median for the following frequency distribution :
x : 1 2 3 4 5 6 7 8 9
f : 8 10 11 16 20 25 15 9 6 is :
(A) 4 (B) 5 (C) 6 (D) None of these
Sol.
(3) Median of grouped data or continuous series: Let the no. of observations be n
(i) Prepare the cumulative frequency table
(ii) Find the median class i.e. the class in
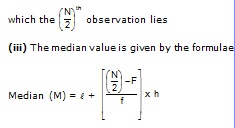
N = total frequency =
i = lower limit of median class
f = frequency of the median class
F = cumulative frequency of the class preceding the median class
h = class interval (width) of the median class
(4) Properties of Median :
(a) The sum of the absolute value of deviations of the items from median is minimum
(b) It is a positional average and it is not influenced by the position of the items.
F. MODE
Mode is that value in a series which occurs most frequently. In a frequency distribution, mode is that variate which has the maximum frequency.
(1) Computation of Mode :
(i) Mode for individual series : In the case of individual series, the value which is repeated maximum number of times is the mode of the series.
Ex.12 Mode of the data 3, 2, 5, 2, 3, 5, 6, 6, 5, 3, 5, 2, 5 is-
(A) 6 (B) 4 (C) 5 (D) 3
Sol. Since 5 is repeated maximum number of times, therefore mode of the given data is 5.
(2) Mode for grouped data (discrete frequency distribution series)
In the case of discrete frequency distribution, mode is the value of the variate corresponding to the maximum frequency.
(3) Mode for continuous frequency distribution :
(i) First find the model class i.e. the class which has maximum frequency. The model class can be determined either by inspecting or with the help of grouping data.
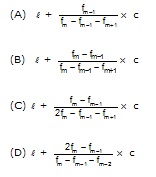
(ii) The mode is given by the formula Mode
![]()
where l ® lower limit of the model class
h ® width of the model class
fm ® frequency of the model class
fm–1 ® frequency of the class preceding model class
fm+1 ® frequency of the class succeeding model class
(iii) In case the model value lies in a class other than the one containing maximum frequency (model class) then we use the
![]()
(4) Properties of Mode : It is not effected by presence of extremely large or small items.
Relationship between mean, mode and median:
(i) In symmetrical distribution
Mean = Mode = Median
(ii) In skew (moderately symmetrical) distribution
Mode = 3 median – 2 mean
Ex.13 If the value of mode and mean is 60 and 66 respectively, then the value of median is-
(A) 60 (B) 64 (C) 68 (D) None of these
Sol![]()
G. Measures of Dispersion
Dispersion is the measure of the variations. The degree to which numerical data tend to spread about an average value is called the dispersion of the data.
The measures of dispersion commonly used are:
(i) Range
(ii) Quartile deviation or the semi- interquartile range
(iii) Mean Deviation
(iv) Standard Deviation
Here we will discuss the mean deviation and standard deviation.
H. Mean Deviation
Mean deviation is defined as the arithmetic mean of the absolute deviations of all the values taken about any central value.
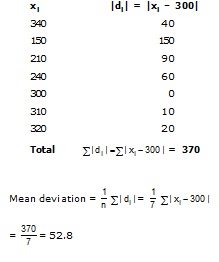
(1) Mean deviation of individual observations: If x1, x2, ......, xn are n values of a variable x, then the mean deviation from an average A (median or AM) is given by
![]()
Ex.14 The mean deviation about median from the following data :
340, 150, 210, 240, 300, 310, 320, is
(A) 52.4 (B) 52.5 (C) 52.8 (D) None of these
Sol. Arranging the observations in ascending order of magnitude, we have 150, 210, 240, 300, 310, 320, 340. Clearly, the middle observation is 300. So, median = 300
Calculation of Mean deviation
(2) Mean deviation of a discrete frequency distribution : If x1, x2,....., xn are n observation with frequencies f1, f2, ....., fn, then mean deviation from an average
A is given by -
![]()
(3) Mean deviation of a grouped or continuous frequency distribution: For calculating mean deviation of a continuous frequency distribution the procedure is same as for a discrete frequency distribution. The only difference is that here we have to obtain the mid-point of the various classes and take the deviations of these mid points from the given central value (median or mean)
i. Variance and standard deviation
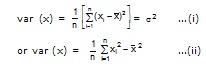
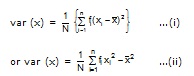
The variance of a variate x is the arithmetic mean of the squares of all deviations of x from the arithmetic mean of the observations and is denoted by var (x) or s2
The positive square root of the variance of a variate x is known as standard deviation i.e.
![]()
(1) Variance of Individual observations :
If x1, x2,....., xn are n values of a variable x, then by definition
If the values of variable x are large, the calculation of variance from the above formulae is quite tedious and time consuming. In that case, we take deviation from an arbitrary point A (say) then var (x)
![]()
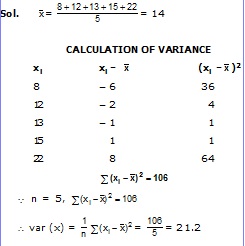
Ex.15 Marks of 5 students of a tutorial group are 8, 12, 13, 15, 22 then variance is:
(A) 21 (B) 21.2 (C) 21.4 (D) None of these3.
(2) Variance of a discrete frequency distribution: If x1, x2,......, xn are
n observations with frequencies f1, f2,.....,fn then
If the values of x or f are large, we take the deviations of the values of variable x from an arbitrary point A. (say)
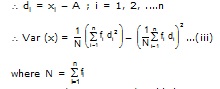
Sometime di = xi – A are divisible by a common number h ( say) then
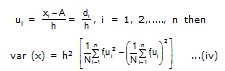
(3) Variance of a grouped or continuous frequency distribution : In a grouped or continuous frequency distribution any of the formulae discussed in discrete frequency distribution can be used.
J. Mean and variance of binomial distribution
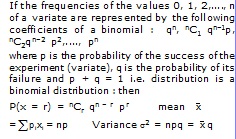
Ex.16 The mean and variance of a variate X having a binomial distribution are 6 and 4 respectively. Find the number of values of the variate in the distribution.
Sol. Here np = 6, npq = 4
![]()
ASSIGNMENT
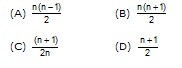
1 Mean of first n natural numbers is
2. Following table shows the weight of 12 students:
Weight (in kgs.) No. of students
67 4
70 3
72 2
73 2
75 1
then mean weight is
(A) 70.25 kg. (B) 70.50 kg.
(C) 70.75 kg. (D) None of these
3. A factory employs 100 workers of whom 60 work in the first shift and 40 work in the second shift. The average wage of all the 100 workers is Rs.38. If the average wage of 60 workers of the first shift is Rs.40, then the average wage of the remaining 40 workers of the second shift is-
(A) 35 (B) 40 (C) 45 (D) None of these
4. If is the mean of a set of n observations ![]()
(A) M.D. about mean (B) S.D.
(C) 0 (D) None of these
5. If the mean of 3, 4, x , 7, 10 is 6, then the value of x is-
(A) 4 (B) 5 (C) 6 (D) 7
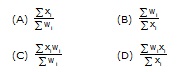
6. Weighted mean is computed by the formula
7. The mean of a set of numbers is . If each number is increased by l, the mean of the net set is
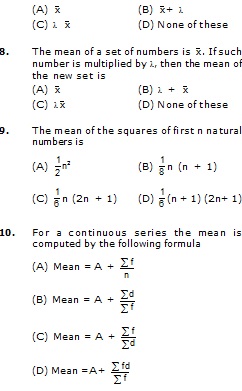
11. If each observation of a raw data whose variance is s2, is increased by l, then the variance of the new set is
![]()
12. Let s be the standard deviation of n observations. Each of the n observations is multiplied by a constant c. Then the standard deviation of the resulting numbers is
![]()
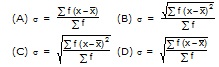
13. For a frequency distribution standard deviation is computed by
14. Which of the following is not a measure of central tendency
(A) Mean (B) Median
(C) Mode (D) Range
15. If the mean of the first n odd natural numbers be n itself, then n is
(A) 1
(B) 2
(C) 3
(D) any natural number
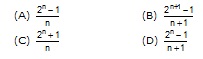
16. The A.M. of the series 1, 2, 4, 8, 16,...., 2n is
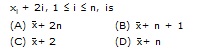
17. If the mean of the set of numbers x1, x2, x3,....,xn is , then the mean of the numbers
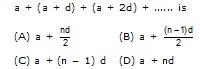
18. Mean of the first n terms of the A.P.
19. If m is the mean of a distribution, then
![]()
20. If the mean of n observations 12, 22, 32,....,
![]()
21. Product of n positive numbers is unity.The sum of these numbers can not be less than
(A) 1 (B) n (C) n2 (D) None of these
22. The median of the data 13, 14, 16, 18, 20, 22 is
(A) 17 (B) 16 (C) 18 (D) None of these
23. For a continuous series, the mode is computed by the formula
24. If mean = (3 median – mode) x, then the value of x is
(A) 1 (B) 2 (C) 1/2 (D) 3/2
25. Which of the following is not a measure of dispersion?
(A) variance
(B) mean deviation
(C) standard deviation
(D) mode
Passage based Questions (Q. 26 - 28)
A frequency distribution is given :
Mark : No. of students :
4 6
5 7
6 10
7 8
8 3
26. Mode of the given distribution is:
(A) 5 (B) 6 (C) 8 (D) 10
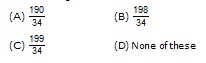
27. Mean of the given distribution is :
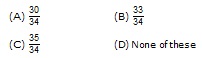
28. Mean deviation from median is :
29. If G1, G2 are the geometric means of two series of observations and G is the geometric mean of the ratios of the corresponding observations, then the value of G
![]()
30. The median of a set of 9 distinct observations is 20.5 If each of the largest 4 observations of the set is increased by 2, then the median of the new set
(A) remains the same as that of the original set
(B) is increased by 2
(C) is decreased by 2
(D) is two times the original median
31. In an experiment with 15 observations on x, the following results were available
![]()
One observation that was 20 was found to be wrong and was replaced by the correct value 30. Then the corrected variance is
(A) 8.33 (B) 78.00 (C) 188.66 (D) 177.33
32. Consider the following statements
(a) Mode can be computed from histogram
(b) Median is not independent of change of scale
(c) Variance is independent of change of origin and scale.
Which of these is/ are correct ?
(A) only (a) (B) only (b)
(C) only (a) and (b) (D) (a), (b) and (c)
33. In a series of 2n observations, half of them equal a and remaining half equal – a. If the standard deviation of the observations is 2, then |a| equals
![]()
34. If in a frequency distribution, the mean and median are 21 and 22 respectively, then its mode is approximately
(A) 22.0 (B) 20.5 (C) 25.5 (D) 24.0
35. Let x1, x2, ..... xn be n observations such that
![]()
36. Suppose a population A has 100 observations 101, 102,.... 200, and another population B has 100 observations 151, 152,.....250. If VA and VB represent the variances of the two
![]()
(A) 9/4 (B) 4/9 (C) 2 (D) 1
ANSWER KEY
1. D 2. A 3. A 4. C
5. C 6. C 7. B 8. C
9. D 10. D 11. A 12. B
13. C 14. D 15. D 16. B
17. B 18. B 19. C 20. A
21. B 22. A 23. C 24. C
25. D 26. B 27. C 28. B
29. A 30. A 31. B 32. C
33. C 34. D 35. B 36. D